
cartography and geospatial data analysis by
Sarah Harman
I use geospatial data to uncover insights and address pressing challenges. With a strong foundation in data analysis and GIS, I work on projects related to urban planning, environmental conservation, and disaster response. My goal is to transform raw data into actionable knowledge that drives informed decisions, strengthens communities, and deepens our understanding of spatial patterns.
Relevant Experience
GIS Intern
Department of Energy, Clean Cities and Communities Accelerate Program - East Tennessee Clean Fuels Coalition
September 2025 – December 2025
During my time interning with the East Tennessee Clean Fuels Coalition, I supported projects that advance clean transportation and sustainable energy initiatives across our region. My work involved using geospatial analysis and mapping tools to visualize alternative fuel infrastructure, assessing transportation data, and helping identify opportunities to reduce emissions in East Tennessee. This experience has strengthened my skills in GIS, data visualization, and environmental planning while contributing to sustainability efforts.
Created cartographic visualizations using ArcGIS Pro, AGOL, and MapGeo to communicate clean energy and alternative fuel initiatives to stakeholders and the public across the region.
Validated, updated, and managed geospatial datasets using Excel and ArcGIS platforms to ensure spatial accuracy and consistency across stakeholder and infrastructure maps.
Collaborated with cross-functional teams to produce map products and outreach materials that enhance public awareness of emission reduction and air quality improvement efforts.


Portfolio


Skills Highlighted:Terrain Analysis, Contour Generation, Raster Reclassification, Spatial Constraints Mapping, Thematic CartographyDescription:Conducted a terrain-based site suitability analysis to identify potential vineyard locations in the San Diego region. Derived contour lines and hillshade from elevation data, reclassified terrain above 200 meters, and isolated viable vineyard areas based on elevation thresholds and spatial criteria. Combined terrain visualization techniques with suitability mapping to highlight optimal agricultural zones.Impact:This analysis demonstrates how terrain modeling can guide agricultural planning by identifying land areas with environmental characteristics favorable for vineyard development. The map supports land managers and growers seeking to evaluate elevation-driven microclimates and improve site selection decisions.Key Contributions:
Generated hillshade and contour lines to visualize topography and elevation change.
Reclassified elevation data to identify areas above 200 meters suitable for vineyard cultivation.
Integrated terrain data with spatial constraints to delineate viable vineyard sites.
Designed a polished map layout combining hillshade, elevation symbology, contours, and site highlights.

Hydrology Analysis of Pumpkin Creek Watershed

Skills Highlighted:Terrain Analysis, Hydrologic Modeling, Raster Processing, Watershed DelineationDescription:Performed a full hydrologic analysis of the Pumpkin Creek watershed using a digital elevation model (DEM). Generated key terrain derivatives including slope, aspect, flow direction, and flow accumulation, which can be used to model water movement across the landscape. Extracted stream networks, assigned stream order values, and delineated the watershed boundary based on surface runoff patterns.Impact:This analysis provides a foundational understanding of how water flows through the Pumpkin Creek basin. The results support water resource planning, flood mitigation mapping, and environmental management by identifying drainage patterns, potential stream paths, and high-accumulation zones.Key Contributions:
Derived terrain metrics (slope, aspect) from a DEM to understand watershed topography.
Generated flow direction and flow accumulation rasters to model hydrologic pathways.
Extracted stream networks and classified them using stream order hierarchy.
Delineated the watershed boundary using hydrologic modeling tools.
Designed a multi-panel map layout clearly visualizing each hydrologic component.
Bald Eagle Habitat Suitability Analysis

Skills Highlighted:Raster Analysis, Weighted Overlay Modeling, Environmental Suitability Assessment, Thematic CartographyDescription:Created a weighted suitability model to identify optimal habitat regions for bald eagles within the San Bernardino National Forest. Combined factors such as elevation, slope, land cover, and proximity to water by standardizing each dataset and applying weighted influence values. Produced a suitability surface and extracted the most suitable regions for visualization and interpretation.Impact:This analysis demonstrates how multi-criteria raster modeling can support wildlife management and conservation planning. The results help land managers pinpoint high-quality habitat areas and make informed decisions about species protection, land use, and resource allocation.Key Contributions:
Reclassified environmental datasets and standardized them to a common suitability scale.
Applied the Weighted Overlay tool to combine multiple ecological factors into a single suitability surface.
Identified and extracted highly suitable habitat zones for targeted analysis.
Designed a clear, professional map showing suitability scores and priority habitat regions.

A Comparison of Census Tracts vs Block Groups for Light Rail Service Analysis

Skills Highlighted:
Vector Analysis, Spatial Selection, Demographic Mapping, Thematic CartographyDescription:
Used a 2-mile buffer around the Phoenix light rail line to identify intersecting 2010 census tracts and calculate the total and average populations within the light rail service area. Represented tract-level populations using a graduated color scheme to visualize density patterns relative to transit accessibility.Impact:
This map demonstrates how spatial selection methods can identify communities served by transit infrastructure. It provides insights for urban planners assessing equitable access to public transportation.Key Contributions:
Applied the Select by Location tool using the “intersect” criterion to capture relevant tracts.
Computed total and average population within the 2-mile light rail buffer.
Designed a cartographically clear population density map for Phoenix’s light rail service area.
Illustrated the Modifiable Areal Unit Problem (MAUP) through tract-level analysis.

Age Distribution Analysis by County

Skills Highlighted:
Thematic Mapping, Demographic Analysis, Cartographic Design, Data VisualizationDescription:
Created a dual choropleth map illustrating the spatial distribution of youth (ages 0–17) and elderly (ages 65+) populations in Orange County, California, using 2010 U.S. Census data. The map classifies census tracts by the percentage of each age group to compare patterns of generational concentration across the county.Impact:
This project demonstrates how GIS can be used to analyze population structure and visualize demographic patterns, supporting applications in urban planning, social services, and community resource allocation.Key Contributions:
Processed and mapped U.S. Census demographic data at the census tract level.
Applied consistent classification schemes for visual comparison between age groups.
Designed a clear, comparative layout to highlight spatial trends in youth and elderly populations.
Enhanced map readability through effective use of color gradients, legends, and cartographic elements.
California Earthquake Population Analysis

This map analyzes the spatial relationship between California’s major population centers and areas of high seismic risk by mapping historical earthquakes over 7 MMI, generating 20-mile buffer zones around epicenters, and performing a spatial join to identify cities and populations located within these earthquake threat zones. This project utilizes demographic data and county boundaries to visualize population exposure and geographic vulnerability across the state.
Mapped historical earthquake epicenters across California with magnitudes over 7 MMI using geospatial point data
Created 20-mile buffer zones around each major earthquake epicenter to represent high-risk areas of seismic threat
Performed a spatial join to identify which California cities fall within the 20-mile earthquake threat zones
Linked city population data (2023 estimates) to spatial locations to evaluate the population at risk within each buffer zone.
COVID-19 Mortality and Income Disparity in Georgia

Skills Highlighted:
Thematic Mapping, Data Visualization, Socioeconomic Analysis, Spatial Statistics
Description:
Developed a choropleth map and graduated symbol overlay to analyze the relationship between median household income and COVID-19 death rates across Georgia counties. The map uses income brackets to classify counties and visually correlates them with COVID-19 death rates per 1,000 people using proportional symbols.
Impact:
This project demonstrates how GIS can be used not only for geographic representation but for meaningful social inquiry. It bridges public health and economic geography, highlighting the real-world value of spatial analysis.
Key contributions:
Integrated socioeconomic and public health datasets to examine spatial disparities
Applied cartographic design principles to maximize interpretability and insight
Revealed patterns that could support policy-making and resource allocation decisions in vulnerable communities
Oregon Emergency Evacuation Project

By sorting, analyzing and layering data such as major cities, roadways, hospitals, airports, streams, and railroads, I was able to gain new insights and design emergency evacuation procedures for potential volcanic eruptions in Oregon. This project emphasized the importance of geospatial technology to enhance disaster response strategies and save lives.
Designed evacuation routes so that all perimeters of blast radius affected have disaster response strategy
Selected the five nearest hospitals and airports outside of damage radius
Provided multiple strategies of evacuation and responder locations to reduce casualties
Oregon Natural Disaster Project

Using geospatial data regarding location and size of volcanic structures in the state of Oregon, I was able to predict the blast radius of each potential volcanic eruption along with its impact on population and infrastructure
Analyzed and visualized the range of damage of various volcanic eruptions based on classification and size
Used volcanic damage radius to visualize affected major cities, hospitals, airports, railroads, streams and roadways
Layered blast radius over population density to calculate potential population impacted
National Park Wildlife Project
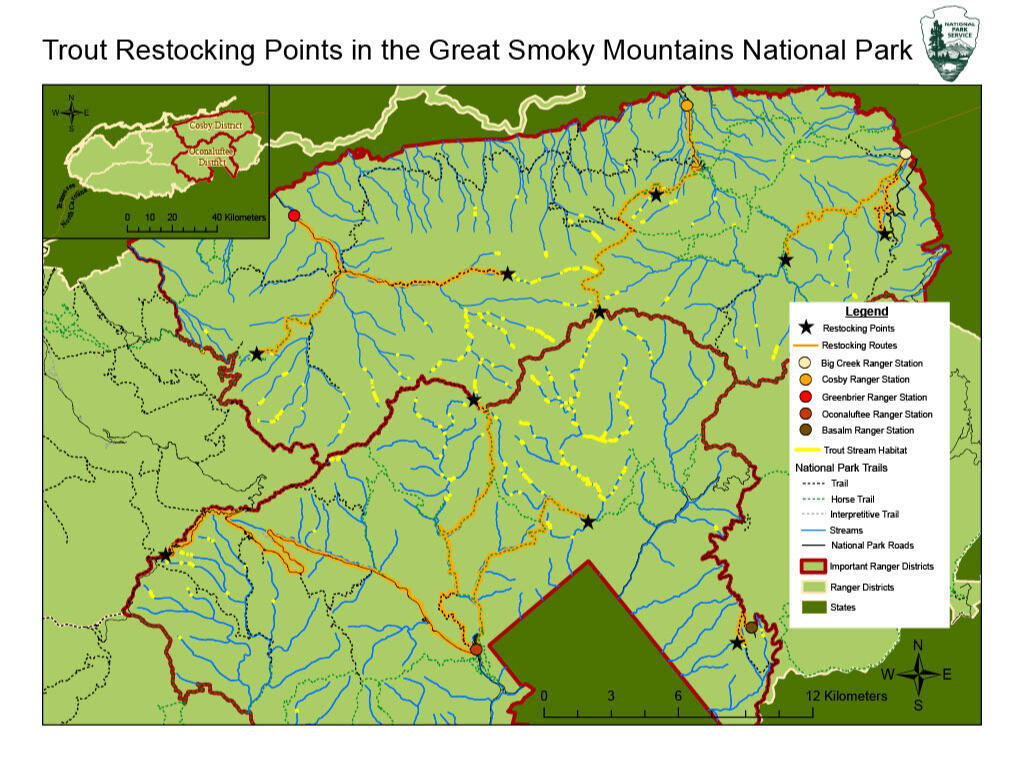
By analyzing geospatial data for the Great Smoky Mountains National Park, I identified suitable streams for native trout and created a map highlighting trout restocking stations for park rangers.
Analyzed elevation and water temperature data to evaluate suitable habitats for native trout
Evaluated the proximity of viable streams to park trails and ranger stations, only selecting trout restocking locations within accessible distances
Transformed raw data into a map to support biological preservation and trout conservation efforts in the Great Smoky Mountains National Park
Maryville College Cross Country Course Project

In this project I was able to showcase my urban planning skills by collecting field data with GPS devices, which I then integrated into GIS software to design a cross-country course that met the client's specifications.
course designed to meet qualifications of 6 km for the women's course and 8 km for the men's, with a start and finish line in the field next to the Crawford House, to accommodate crowd seating and viewing
Adapted to client’s request changes as the project progressed to better accommodate runners, such as eliminating narrow trails and steep slopes from the course
Academics
Bachelor of Science Degree in
Geographic Information Science
- est graduation May 2026
Arizona State University - Tempe, Arizona
Current GPA: 3.8
By going to a large university such as Arizona State I have had the luxury of having a degree program specifically tailored to my interests. By obtaining a degree in geographic information science, I am able to gain a comprehensive understanding of geospatial data analysis. I have been inspired by the prospects of visualizing and combining different data to gain new insights on issues. I believe the advancement of spatial data can be used to improve lives, and I am very excited to ignite that change in the world through the opportunities my education will provide. I am currently part of the Youthmappers Club at ASU, where we collaborate on creating humanitarian maps to improve societal issues.
Relevant Courses:
Geographic Information Science I, II, & III | GIS for Climate Change Science | Principles of Programming | Programming for GIS | Geography of Natural Resources | Cartography and Georepresentation | Stats for Geography and Planning
Studied Environmental Science at Maryville College 2022 - 2023
Maryville College - Maryville, TN
Dean's List both semesters
During my time at Maryville College, I further delved into my interests in various different aspects of environmental science. It was here that I took a course in Geographic Information Systems, where I discovered a passion for the translation and visualization of data. I learned that by layering geospatial data one can gain new insights and solve real world problems. Had I not attended Maryville College I may have never heard of GIS or learned the art of cartography. This part of my academic journey was crucial for my overall path in life, as it inspired me to seek out a degree in geographic information science.
Relevant Courses:
Geographic Information Systems | Ecology | Earth System Science | Contemporary Global Issues
Associate of Applied Science in Environmental Health and Technology - 2021
Roane State Community College- Oak Ridge TN
Graduated summa cum laude
During my time at Roane State I was continuously inspired by taking various different science courses. It wasn't before long that I became fascinated by environmental health and safety, declaring it as my major after my first semester. This niche degree gave me a unique experience by covering several facets of environmental science including utilizing radiological and environmental monitoring technology, learning about environmental laws and regulations, learning proper PPE protocol, along with several foundational science courses.
Relevant Courses:
Environmental Instrumentation and Technology | Safety and Emergency Response | Physical Geology | Environmental Science | Environmental and Occupational Law and Regulations | Waste Management and Pollution Prevention | Biology I & II | Chemistry I & II | Statistics
About Me
I was born and raised in East Tennessee, shifting around throughout the years from Sevierville to Knoxville, and everywhere in between. I have always loved the unique nature that this area of the Appalachian Mountains provides, being one of the only temperate rainforests in the world.I have drifted towards science from a young age, with my first academic trophy being in sixth grade for outstanding scientific achievements. My great grandfather was a chemist at the Oak Ridge National Laboratory, and my father soon followed in his footsteps as an industrial hygienist.My academic journey has represented my growth in finding my ideal career path. My degree at Roane State gave me a passion for environmental health and technologies. Soon after graduating I went to a small local private college with less than a thousand students. It was here I was introduced to a GIS course where I discovered my love of data analysis and visualization. Unfortunately, the one course was all that was offered on the topic, and it wasn't long until I found out about Arizona State University's unique degree programs and transferred to major in Geographic Information Science.I cannot express the excitement I feel to have finally found my path. From my time pursuing GIS, I have already seen the amazing applications of layering geospatial data to gain new insights and help solve complex real world problems. I believe this is the technology of the future, and I am so happy to have the opportunity to be a part of the revolution of utilizing data to extract knowledge and embetter humanity.As much as I love STEM, I also thoroughly enjoy the arts. My adoration for nature shows through my artworks, whether they be acrylic paintings or textural pieces. I get my inspiration from my adventures in nature, hiking the Appalachian trails I grew up next to. I also have a hobby for antique collecting, which subsequently led me to opening and operating an art restoration business for public domain antique artworks. I use digital software to enhance the quality and fix any damage from aging and fading. I really enjoy preserving these artworks so they are not lost to time, and I try to find as much information as possible about the artist so their accomplishments are not forgotten.I hope this helped you learn more about who I am as a person! Feel free to contact me to discuss any available opportunities, including research collaborations.
Contact Information
You can contact me through emailing me directly at [email protected] or by filling out the box below.